

Pure Frontend Word Cloud Display + Weibo Hot Search Word Cloud Demo Code
Preface Recently at work I did several large-screen data visualization projects, which also used word cloud displays. Previously I always used Python libraries to generate images for word clouds; this time I used a pure frontend implementation ~~(Ctrl+V is so handy)~~, and while I was at it I made a Weibo hot search word cloud and recorded it here~ Dependencies echarts 4.x echarts-wordcloud 1.1.3 tips: echarts-wordcloud currently has two versions, 2.0 and 1.x; 2.0 corresponds to echarts 5.x
目录9 个章节
Preface
Recently at work I did several large-screen data visualization projects, which also used word cloud displays. Previously I always used Python libraries to generate images for word clouds; this time I used a pure frontend implementation (Ctrl+V is so handy), and while I was at it I made a Weibo hot search word cloud and recorded it here~
Dependencies
- echarts 4.x
- echarts-wordcloud 1.1.3
tips: echarts-wordcloud currently has two versions, 2.0 and 1.x; 2.0 corresponds to echarts 5.x
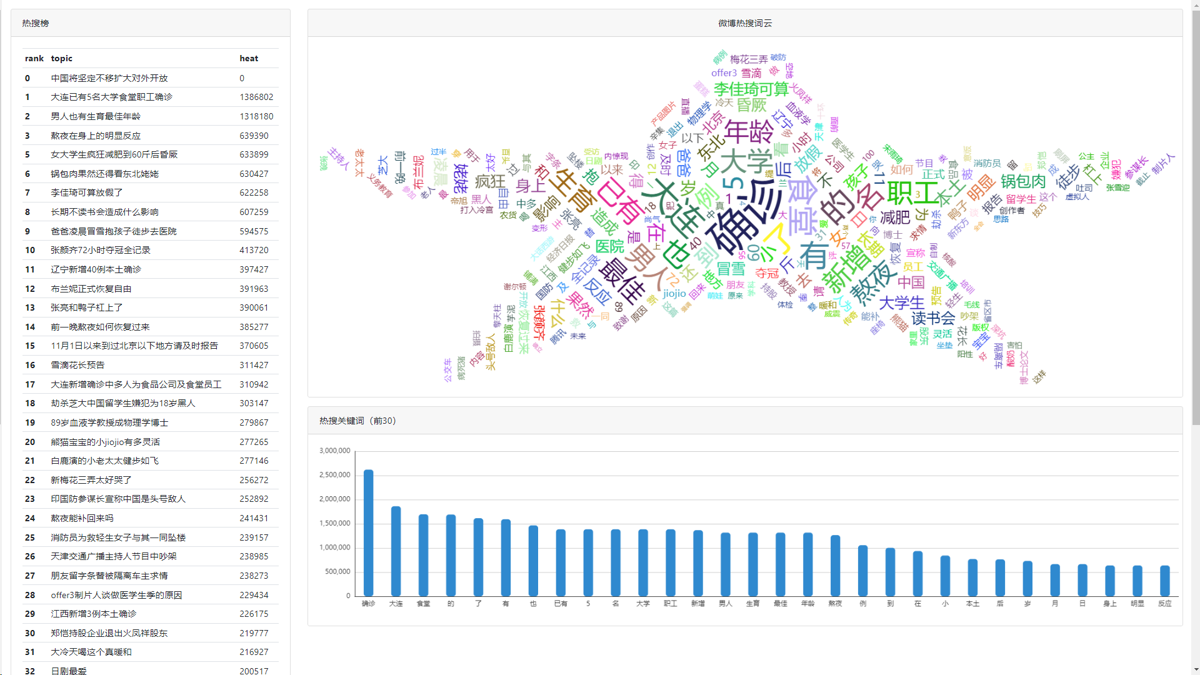
Results
- Preview URL: http://www.sblt.deali.cn:9000/weibo_top/
Implementation Process
First, create a new HTML file (obviously)
Since we're using echarts, we need a div to hold the canvas:
<div class="chart" id="chartWordCloud" style="width: 100%;height: 600px;"></div>
Next is the JS part
The Weibo hot search data uses an API from my previous OneCat project. The data looks roughly like this:
(The hot search keyword data is obtained by a crawler fetching Weibo hot search data, then performing word segmentation and calculation. It's not very rigorous at the moment; I feel it should do part-of-speech analysis and only take nouns and verbs for statistics, which would look better)
{
    "detail": "微博热搜关键词",
    "data": [
        {
            "name": "男子",
            "rank": 1.0,
            "heat": 1552222,
            "count": 1
        },
        {
            "name": "直播间",
            "rank": 1.0,
            "heat": 1552222,
            "count": 1
        },
        {
            "name": "捡漏",
            "rank": 1.0,
            "heat": 1552222,
            "count": 1
        }
    ]
}
As you can see, each hot search keyword already has heat, occurrence count, and weighted rank~
After getting the data ready, next we need to render the word cloud
First we need a function that randomly generates colors, so we can get that colorful effect
function randomColor() {
    return 'rgb(' + [
        Math.round(Math.random() * 255),
        Math.round(Math.random() * 255),
        Math.round(Math.random() * 255)
    ].join(',') + ')'
}
Initialize the echart object
let chart = echarts.init(document.querySelector('#chartWordCloud'))
The code is as follows
fetch(API).then(res => res.json()).then(res => {
    let originData = res.data.map(item => ({
        name: item.name,
        value: item.heat
    }))

    const data = originData.map(val => ({
        ...val,
        textStyle: {
            normal: {
                color: randomColor()
            }
        }
    }))

    chart.setOption({
        series: [{
            type: 'wordCloud',
            shape: 'star',
            left: 'center',
            top: 'center',
            right: null,
            bottom: null,
            width: '100%',
            height: '100%',
            sizeRange: [10, 80],
            rotationRange: [-90, 90],
            rotationStep: 45,
            gridSize: 8,
            drawOutOfBound: false,
            textStyle: {
                normal: {
                    fontFamily: 'sans-serif',
                    fontWeight: 'normal'
                },
                emphasis: {
                    shadowBlur: 10,
                    shadowColor: '#333'
                }
            },
            data
        }]
    })
})
Trying It Out
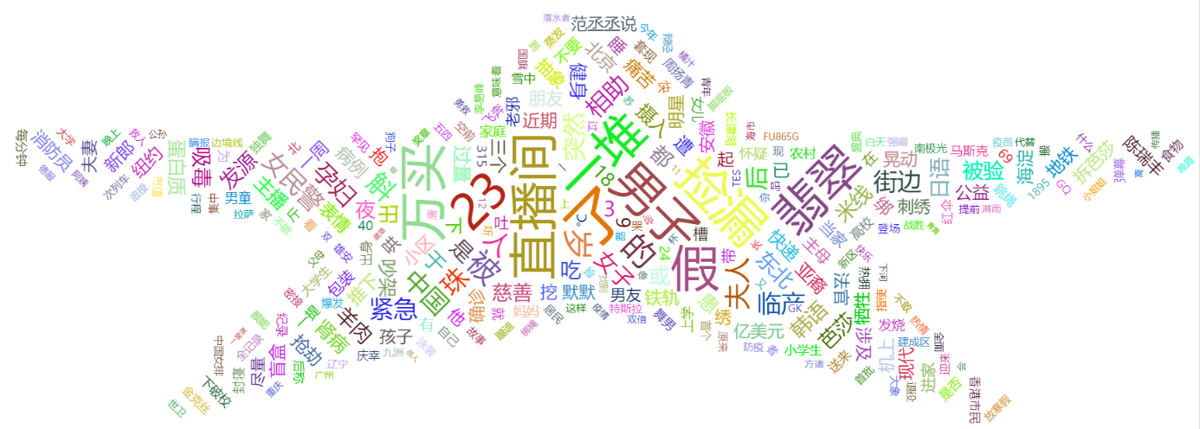
I set the shape to a five-pointed star, and the result looks like this:
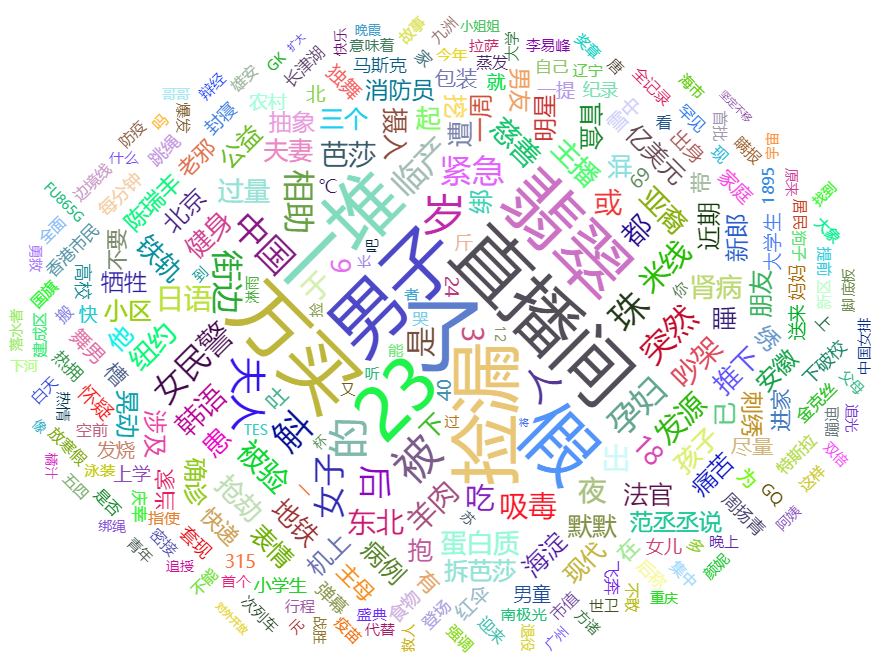
This is the circle:
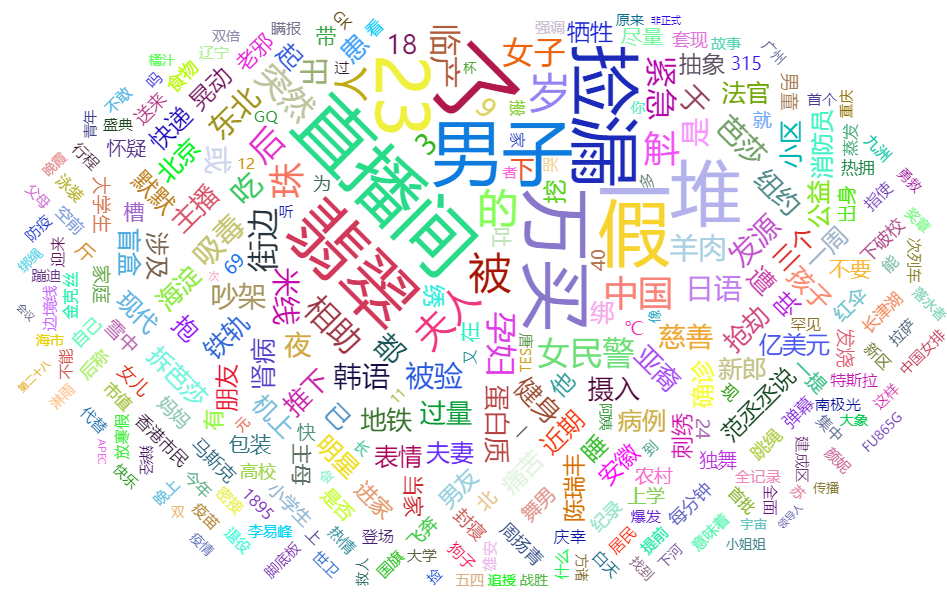
If I change it to a heart shape, it looks like this*(doesn't really look like one*
Let's try a diamond
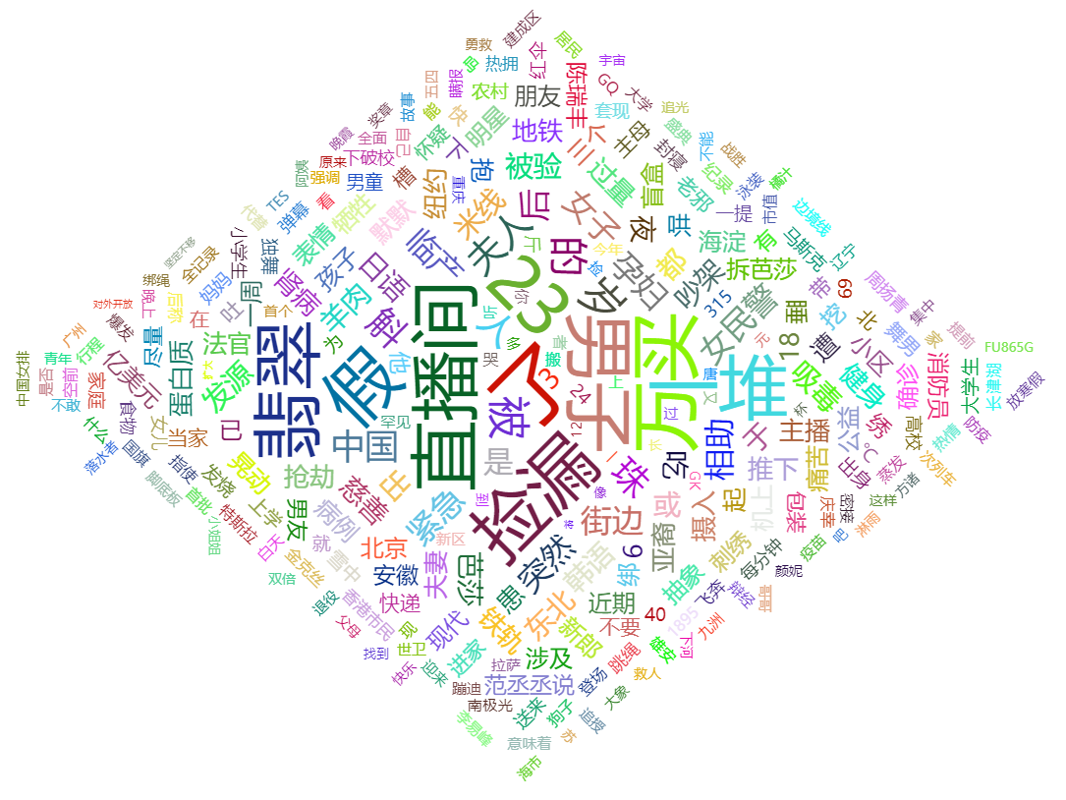
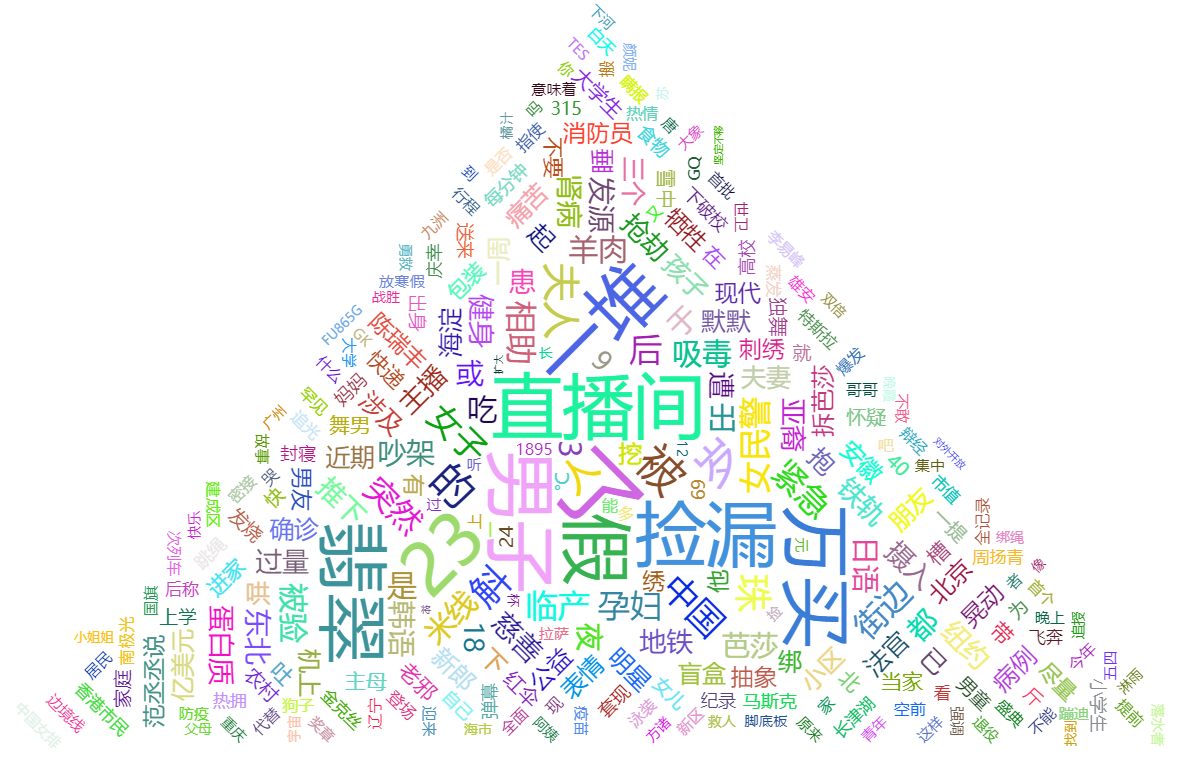
Triangle
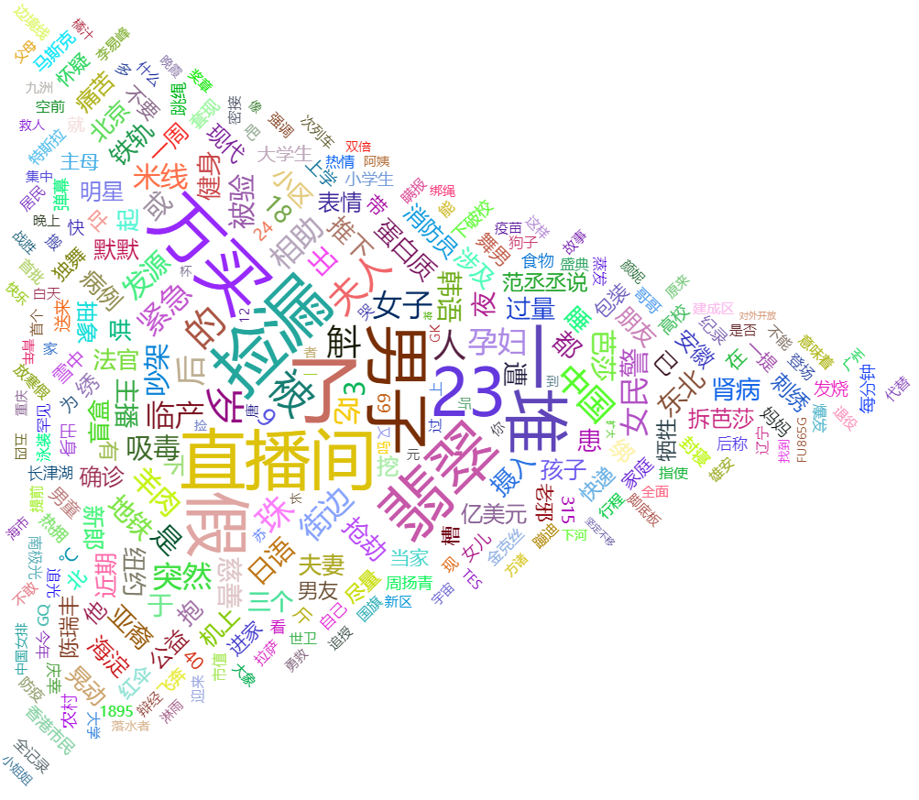
A lying-down triangle
Okay, I'll stop messing around~
What each configuration does
shape: The shape of the word cloud. Default iscircle. Optional values arecardioid,diamond,triangle-forward,triangle,star.left top right bottom: Position of the word cloud. Default iscenter center.width height: Width and height of the word cloud. Default is75% 80%.sizeRange: Font size range of the word cloud text. Default is[12, 60]. The word cloud renders font sizes based on thevaluein the provided raw data. Taking the default as an example, the smallestvalueis rendered as12px, the largest as60px, and intermediate values are calculated proportionally.rotationRange rotationStep: The angle of text in the word cloud. Text will randomly rotate within therotationRange, and the rendering step isrotationStep. The smaller this value, the more kinds of angles appear in the word cloud. Taking the parameters above as an example, possible rotation angles are-90 -45 0 45 90.gridSize: Spacing between each word in the word cloud.drawOutOfBound: Whether to allow the word cloud to render outside the bounds. Just use the defaultfalse, otherwise words can easily overlap.textStyle: Style of the text in the word cloud.normalis the initial style,emphasisis the style when the mouse hovers over the text.
Demo Code
Demo written for this article: Deali-Axy/WeiboWordCloud-frontend: Weibo Word Cloud, Frontend (github.com)
URL: https://github.com/Deali-Axy/WeiboWordCloud-frontend
References
- echarts-wordcloud component project URL: https://github.com/ecomfe/echarts-wordcloud
- Blog: https://segmentfault.com/a/1190000023022232
_EOF_
Pure Frontend Word Cloud Display + Weibo Hot Search Word Cloud Demo Code
- 本文作者:
- 程序设计实验室
- 版权声明:
- 本博客所有文章除特别声明外,均采用 BY-NC-SA 许可协议。转载请注明出处!
相关文章
配置Chrome支持网页内的frame跨域
前言 跨域限制可以保证安全,但是调试的时候关掉会更方便,然而现在网络上能找到的关闭跨域限制方法,在新版的Chrome浏览器上根本没用…… 经过一番摸索,发现用旧版的Chrome就可以绕过跨域限制,刚好我做的这个需要跨域内嵌frame的网页只是单纯展示的,所以这个正好符合我的需求,奥利给! 然后我找到了旧版的Chrome软件,解压出来是绿色版的可以直接运行,不过运行后发现直接把系统的Chrome给调
2021-12-18 · Web前端 · 约 1 分钟
使用 swagger-typescript-api 在前端项目里生成请求代码
swagger-typescript-api?文档写得像草稿,还得自己摸索。那些花哨的模块化选项除了报错还能干嘛?老老实实生成单文件,配个客户端封装,省得每次折腾。
2025-11-03 · Web前端 · 约 1 分钟
NPM-Warn--ENOENT--no-such-file-or-directory
Now type the command to auto generate the package.json npm init --yes
2022-07-18 · Web前端 · 约 1 分钟
魔改editormd组件,优化ToC渲染效果
前言 我的StarBlog博客目前使用 editor.md 组件在前端渲染markdown文章,但这个组件自动生成的ToC(内容目录)不是很美观,我之前魔改过一个树形组件 BootStrap-TreeView,所以就想要用这个树形组件来展示ToC。 原本的效果是这样的 image-20221020112752560 我魔改完的效果 image-20221020112914518 先分析一波 首先看
2022-10-20 · Web前端 · 约 1 分钟
讨论
共 0 条加载评论中…